Interwork

Unified Observability Platform for IT & OT Environments

Bridge the Operational Blind Spot Between SCADA Networks and Cloud Infrastructure to Cut Downtime by 30–40% and Accelerate Root-Cause Identification.

Contact Us

Traditional enterprise structures isolate corporate IT monitoring from factory-floor operational technology (OT), leading to unmapped system anomalies, unplanned downtime, and heavy production losses. Our Unified Observability Platform for IT & OT Environments is an enterprise-grade solution designed to eliminate this structural friction. By combining real-time logging from cloud servers, database infrastructures, and microservices with direct data ingest from PLCs, SCADA setups, and IoT sensor networks, we provide a single, comprehensive view of your entire enterprise footprint. We partner with CIOs, CTOs, Plant Heads, and Directors of Operations to shift teams from reactive firefighting to automated, predictive operations—minimizing maintenance overhead, protecting asset longevity, and securing strict SLA adherence across your business.

Breaking Down the Silos Between Enterprise Systems and Physical Assets

Industrial operations bleed significant profit margins when corporate network tracking cannot correlate with machine-level errors on the production line. We dismantle the foundational data and process silos that slow down engineering response times:

Disconnected Monitoring Architectures

Ending the severe division where IT personnel monitor servers in isolation while OT teams track physical machinery on separate local loops.

Delayed Incident Response Windows

Replacing blind, retroactive system troubleshooting with live cross-domain alerting to stop localized faults from causing compounding production outages.

Unmapped Material and Business Impact

Resolving the complete lack of correlation between edge equipment failures, supply chain bottlenecks, and their immediate financial impact on your main ERP ledgers.

High Unplanned Maintenance Costs

Eradicating expensive reactive repair cycles by tracking data patterns across all hardware layers to flag technical problems before they cause breakdowns.

Comprehensive Cross-Domain Ingestion and Observability Layers

Built on a secure, cloud-native data streaming pipeline, our platform ingests, normalizes, and correlates log telemetry across all components of your enterprise ecosystem:

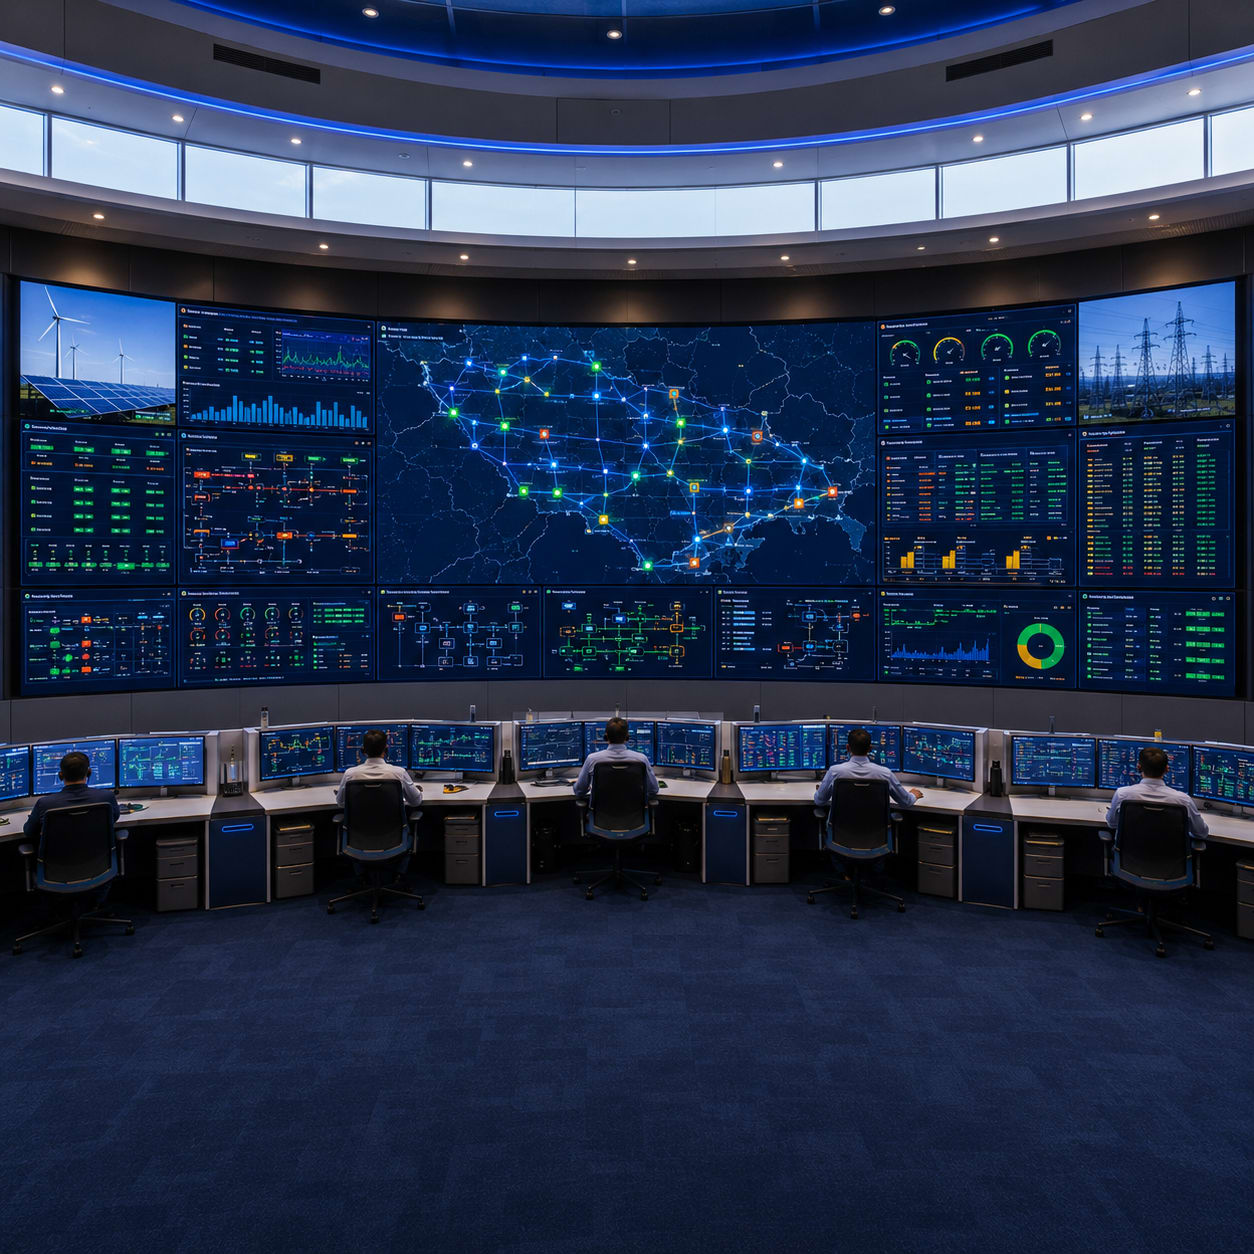
Unified Operational Technology (OT) Layer Monitoring

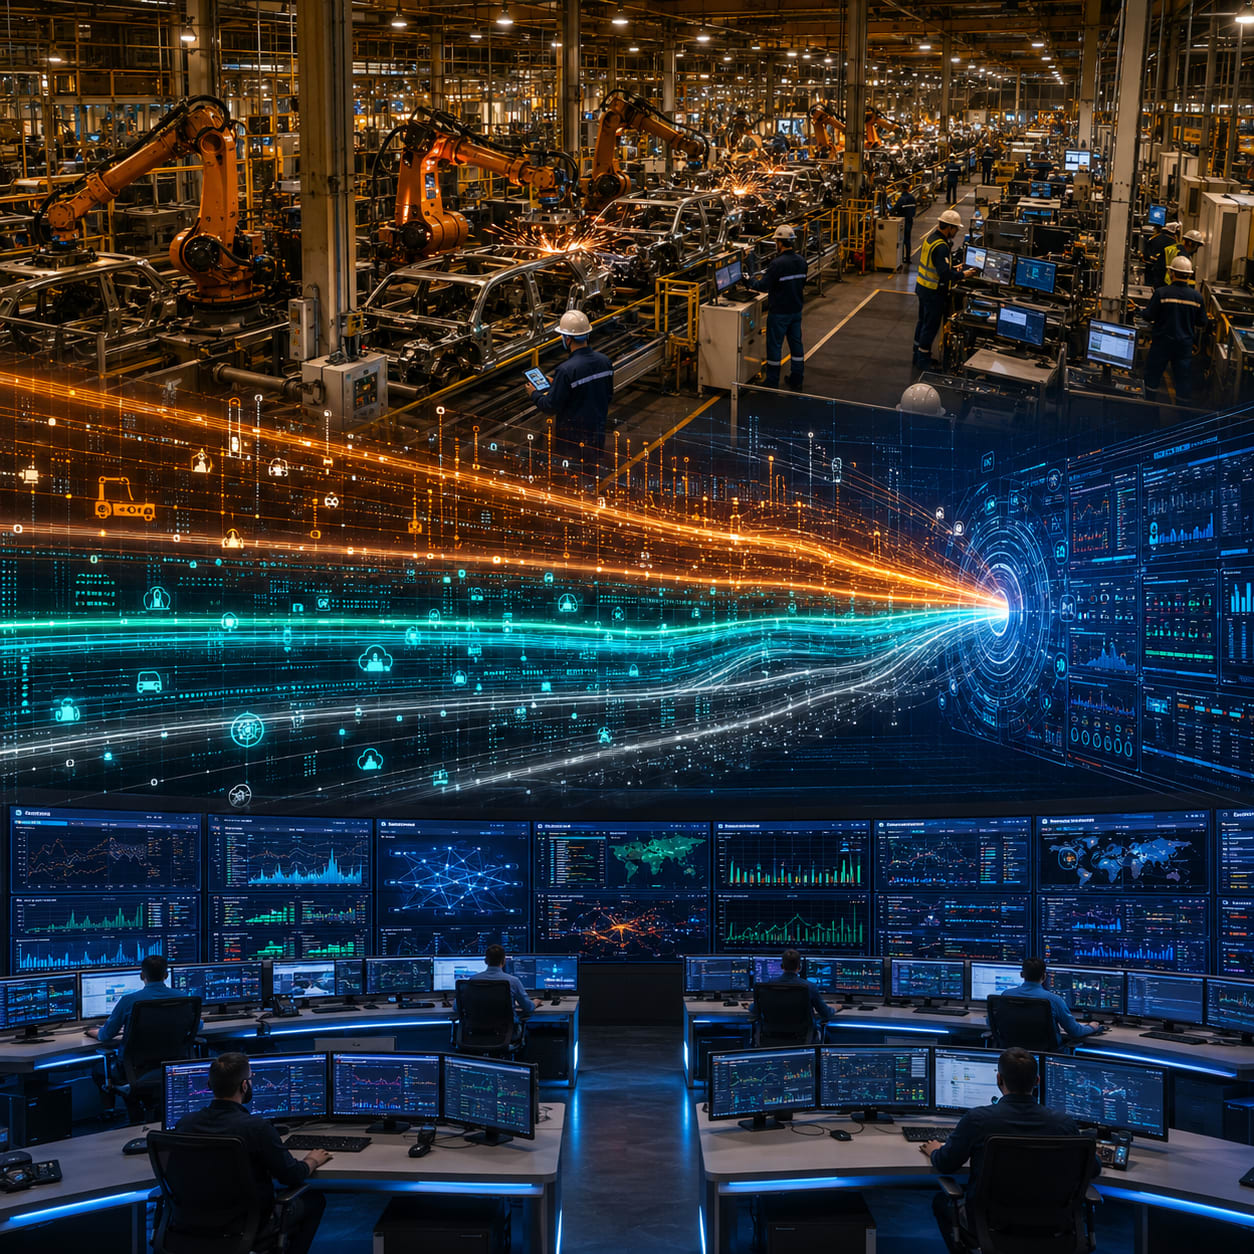
This layer hooks directly into physical shop-floor machinery, industrial assets, and automated distribution environments.

The system translates legacy field engineering languages into clean datasets, tracing performance metrics across supervisory systems and remote IoT hardware arrays to ensure complete operational transparency at the edge.

Capabilities

  • Continuous health and performance monitoring of programmable logic controllers (PLCs) and field sensors.
  • Real-time telemetry ingestion from local supervisory control and data acquisition (SCADA) systems.
  • Live production line asset tracking and assembly environment metric mapping.
  • Telemetry capture from environmental, thermal, and automated IoT sensor networks.

High-Availability Information Technology (IT) Layer Monitoring

Monitor your entire supporting digital architecture, from physical on-premise hardware arrays to distributed cloud application layers.

This component tracks server memory allocations, network traffic loads, database performance, and API delivery rates, ensuring your underlying digital services scale smoothly without performance hits.

Capabilities

  • Continuous performance tracking across corporate routers, switches, firewalls, and edge gateways.
  • Real-time compute resource logging across on-premise, private, and public multi-cloud environments (AWS, Azure, GCP).
  • Deep-layer trace monitoring for containerized microservices and enterprise application endpoints.
  • Continuous performance indexing for core relational databases, message queues, and enterprise middleware.

IT and OT incidents resolved from one command view.

24x7
Continuous monitoring
IT + OT
Unified visibility
MTTR
Measurably reduced
Multi-Site
Single dashboard
Multi-site operations centre with unified IT and OT monitoring

Intelligent Data Orchestration and Analytical Insights

Unified Data Ingestion

Connect, normalize, and process data streams from any source. The platform relies on a distributed edge-plus-cloud hybrid model to gather data across various industrial protocols (OPC-UA, Modbus, SNMP) and enterprise REST/gRPC APIs, processing high-volume datasets without introducing system lag or data dropouts.

Centralized Observability Dashboard

Establish a single source of truth across your technology environment. This console delivers role-based views for plant managers, IT administrators, and engineering operations teams, allowing users to drill down smoothly from high-level enterprise health indicators down to specific factory components.

Intelligent Alerting & Incident Management

Eliminate alert fatigue by implementing automated anomaly profiling. The platform combines threshold logic with automated trend analysis to isolate the exact root cause of cross-system issues, routing alerts through multi-channel notification trees (Email, SMS, WhatsApp) based on priority.

Predictive Insights & Analytics

Shift your operations from reactive repair cycles to structured predictive maintenance. By analyzing historical trend lines across server logs and machine telemetry, the platform flags early signs of equipment wear and capacity shortages, helping managers build efficient, data-driven maintenance plans.

Asset Health & Performance Benchmarking

Track and optimize core engineering efficiency metrics across your global operations. The platform monitors equipment availability logs in real time, tracks Mean Time Between Failures (MTBF) and Mean Time to Repair (MTTR), and runs performance benchmarking routines to compare asset yields across different facilities.

Connections to Actions

Connect

Physical field devices, manufacturing machinery, and core corporate IT assets hook into the platform via secure, pre-built protocol connectors.

Collect

High-velocity telemetry, data strings, and system event logs are captured in real time via localized edge gateways and secure cloud ingestion layers.

Process

Fragmented data payloads are normalized, stripped of false-positive noise, and correlated across IT and OT domains to map business impact.

Visualize

Real-time metrics are displayed on unified, single-pane-of-glass dashboards customized for different management and engineering teams.

Act

Automated alerting rules, programmatic ticket creation, and system integrations trigger instant maintenance responses to neutralize anomalies.

Six capabilities. One platform.

Unified Data Ingestion

OPC-UA, Modbus, SNMP, REST APIs. Real-time streaming. Edge and cloud architecture.

Centralised Observability Dashboard

A single pane of glass with plant manager, IT admin, and operations team views.

Intelligent Alerting

Threshold and anomaly-based detection. Email, SMS, WhatsApp. Cross-layer incident correlation.

Predictive Insights

Trend analysis, early failure signals, capacity insights, maintenance planning.

Asset and Health Monitoring

Machine health, network devices, servers. MTBF and MTTR tracked continuously.

Enterprise Integration

ERP, Oracle, MES, ServiceNow, Jira, data lakes, BI platforms.

Operations command centre with full IT and OT visibility on unified dashboards

Infrastructure and operations in one view. Nothing hidden from the team that needs to act.

Where unified observability matters most.

Manufacturing

Multi-plant operations with mixed PLC vendors, where production losses correlate with IT events.

Energy and Utilities

Distributed grid assets and SCADA, where DNP3 and IEC 61850 must coexist with corporate IT.

Logistics and Warehousing

Conveyors, sorters, WMS integration, and dock door sensors monitored as one connected operation.

Retail and Distributed Operations

Store-level POS, network, and HVAC monitoring rolled up to an enterprise-wide health view.

Architecture and deployment questions.

The platform supports OPC-UA, Modbus TCP, DNP3, IEC 61850, BACnet, and MQTT out of the box. For proprietary protocols, an edge adapter framework allows custom protocol connectors to be built and deployed at the plant level. We have deployed connectivity for Siemens S7, Allen Bradley, and Schneider Electric PLCs in manufacturing environments.
Alerts from both layers are timestamped and ingested into a unified event stream. The correlation engine applies configurable time-window rules to identify alerts across layers that occur within a defined interval. When a correlation is detected, a compound alert is raised with both the IT and OT events linked. Root cause scoring ranks the most likely originating event.
For most manufacturing plants, we recommend a hybrid architecture: edge collectors within the plant network for OT data, a cloud-hosted analytics and dashboard layer for centralised visibility. This keeps OT data local while enabling enterprise-wide dashboards. Full on-premise deployment is available for plants with no external connectivity.
The platform pushes alerts to ServiceNow via the ServiceNow REST API. Alert metadata, including severity, affected asset, correlation ID, and initial root cause assessment, is included in the incident payload. Incidents can be auto-assigned to the correct team based on the alert source layer. Bidirectional sync updates the observability platform when incidents are resolved or reclassified.
A plant of this size typically goes live in 10 to 14 weeks. This covers asset discovery and tagging, protocol configuration for OT devices, IT agent deployment, dashboard configuration, and alert rule setup. The first 4 weeks are discovery and design. The following 6 weeks are deployment and testing. Final 2 to 4 weeks are parallel run with the existing monitoring tools.
Yes. The platform has a multi-tenant architecture where each plant is a separate data domain with its own dashboard and alert configuration. Enterprise-level dashboards aggregate across all plants. Role-based access ensures plant managers see only their plant data, while enterprise users can navigate across plants. Adding a new plant follows a repeatable onboarding playbook.

Unify Your Technology Footprint, Cut Downtime, and Protect Vital Operations

Schedule a technical system review with our cross-domain observability architects. Let's evaluate your IT infrastructure and industrial edge setups to design a secure, low-latency data map that unifies your business operations and prevents expensive system outages.

Contact Us